SSP Models tutorial
[6]:
from milespy import SSPLibrary
from astropy import units as u
import matplotlib.pyplot as plt
import numpy as np
The level of verbosity of milespy can be changed using the logging module, setting the level to either WARNING, INFO or DEBUG.
[7]:
import logging

logger = logging.getLogger("milespy")
# logger.setLevel(logging.DEBUG)
Initialize
[8]:
miles = SSPLibrary(
    source="MILES_SSP",
    version="9.1",
    imf_type="bi",
    isochrone="P",
)
Generate SSP
Directly from parameters (interpolated)
[9]:
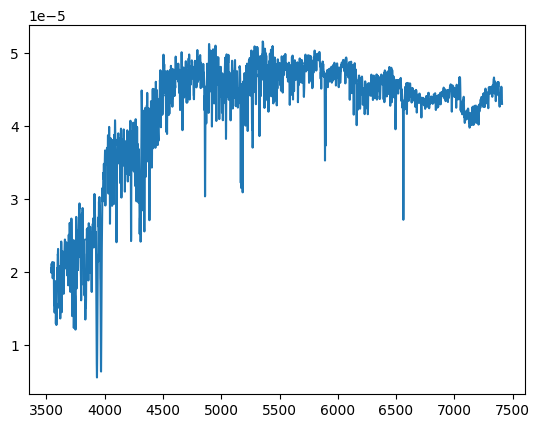
spec = miles.interpolate(
    age=5.7 * u.Gyr,
    met=-0.45 * u.dex,
    imf_slope=1.3,
)
plt.plot(spec.spectral_axis, spec.flux)
plt.show()
Given a range of values
[24]:
spec2 = miles.in_range(age_lims=[7.0, 10.0] << u.Gyr, met_lims=[-0.1, 0.5] << u.dex)
spec2.nspec
[24]:
112
[25]:
np.unique(spec2.age)
[25]:
$[7.0795,~7.9433,~8.9125,~10] \; \mathrm{Gyr}$
[26]:
np.unique(spec2.met)
[26]:
$[0,~0.22] \; \mathrm{dex}$
From a list of parameters
[27]:
spec3 = miles.in_list(
    age=[0.2512, 0.0708, 1.4125] << u.Gyr,
    met=[0.22, 0.0, -1.71] << u.dex,
    imf_slope=np.array([1.3, 1.3, 1.3]),
)
spec3.age
[27]:
$[0.2512,~0.0708,~1.4125] \; \mathrm{Gyr}$
Analyze the spectra
You can load filters from the database and compute derived quantities from those and the SSP spectra
[28]:
import milespy.filter as flib

filts = flib.get(flib.search("sloan"))
outmls = spec.mass_to_light(filters=filts, mass_in="star+remn")

print(
    spec.age,
    spec.met,
    spec.Mass_star_remn,
    outmls["SLOAN_SDSS.u"],
    outmls["SLOAN_SDSS.g"],
    outmls["SLOAN_SDSS.r"],
    outmls["SLOAN_SDSS.i"],
    outmls["SLOAN_SDSS.z"],
)
milespy.magnitudes: Filter SLOAN_SDSS.i [6430.0,8630.0] is outside ofthe spectral range [3540.5, 7409.6]
WARNING:milespy.magnitudes:Filter SLOAN_SDSS.i [6430.0,8630.0] is outside ofthe spectral range [3540.5, 7409.6]
milespy.magnitudes: Filter SLOAN_SDSS.u [2980.0,4130.0] is outside ofthe spectral range [3540.5, 7409.6]
WARNING:milespy.magnitudes:Filter SLOAN_SDSS.u [2980.0,4130.0] is outside ofthe spectral range [3540.5, 7409.6]
milespy.magnitudes: Filter SLOAN_SDSS.z [7730.0,11230.0] is outside ofthe spectral range [3540.5, 7409.6]
WARNING:milespy.magnitudes:Filter SLOAN_SDSS.z [7730.0,11230.0] is outside ofthe spectral range [3540.5, 7409.6]
5.7 Gyr -0.45 dex 0.6223571750923741 nan 1.9871261886373415 1.6757822396390838 nan nan
Compute mags
Note that we can use fancy regex for selecting the filters!
[29]:
import milespy.filter as flib

filts = flib.get(flib.search("sdss.(r|g)"))
outmags = spec.magnitudes(filters=filts, zeropoint="AB")
print(outmags)
{'SLOAN_SDSS.g': 6.401271533249293, 'SLOAN_SDSS.r': 5.723690182070875}
They can be saved as astropy tables using write. By default, the basic format is used and rather than saving to a file it prints the output to stdout. This can be changed with the format and output parameters, respectively.
[30]:
outmags.write(format="fixed_width")
|      SLOAN_SDSS.g |      SLOAN_SDSS.r |
| 6.401271533249293 | 5.723690182070875 |
Compute LS indices
[31]:
import milespy.line_strength_indices as lslib

names = lslib.search("^H.*")
print(names)
indeces = lslib.get(names)

outls = spec.line_strength(indeces)
print(outls["Halpha"])
['H10Fe', 'H_K', 'HdA', 'HdF', 'HgA', 'HgF', 'Hg_sigma_275', 'Hg_sigma_200', 'Hg_sigma_125', 'Hg_sigma_130', 'Hbeta_o', 'Hbeta', 'Halpha', 'Ha_Gregg94']
[2.41603984]
Compute mass-to-light ratios
[34]:
import milespy.filter as flib

filts = flib.get(flib.search("sdss.r"))
outmls = spec.mass_to_light(filters=filts, mass_in="star+remn")
print(outmls)
{'SLOAN_SDSS.r': 1.6757822396390838}
[ ]: